Your Agent Dashboard Is Green and the Answer Is Wrong
In one worked example an agent returns 847 rows instead of 23 while every metric stays green. What agent observability has to record instead.
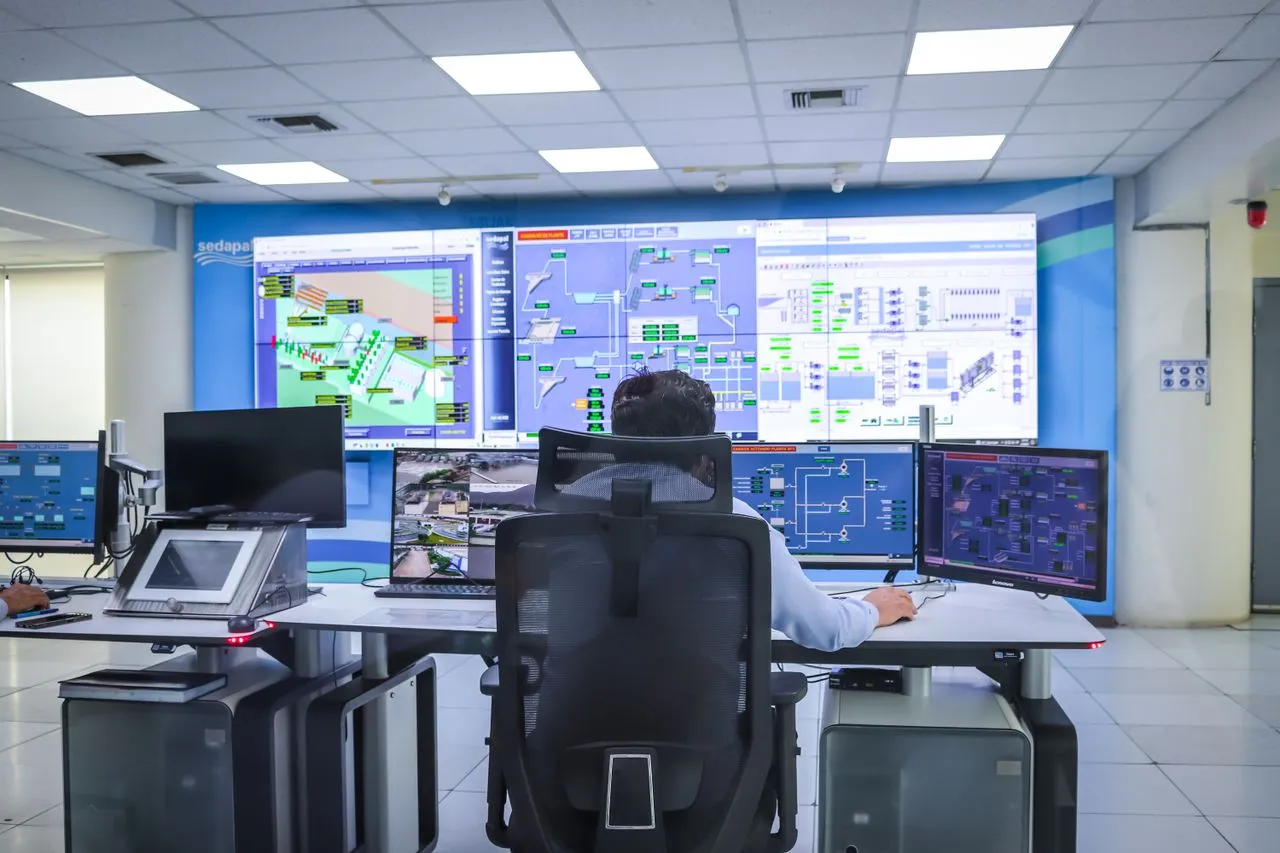
An agent returns 847 customer records when the right answer is 23, and every dashboard stays green. That is the worked example at the center of a Dev.to piece on building an SRE-style operator console for agents, and it names the gap three practitioner write-ups published in the past day all circle: infrastructure monitoring cannot see whether an agent was right.
The 200 OK problem
One of the pieces defines the discipline plainly: AI observability is the practice of tracking what an AI system did and why. The author's argument for why it needs a separate name is that an AI system can return a successful HTTP response and still produce the wrong result. A normal monitoring system tells you the request returned 200. It does not tell you what happened inside that request.
The failure modes listed are specific, and none of them trip an infrastructure alert: the system can return an incorrect answer, retrieve the wrong context, call the wrong tool, produce an unsafe action, or follow the wrong branch in an agent workflow. As that author puts it, the infrastructure worked and the behavior didn't.
The SRE-console piece makes the same point with an example. In its scenario, an agent is asked for customers who signed up in the last 30 days and haven't made a purchase. The dashboard shows green, 400ms response time, 1,200 tokens generated — while the SQL the agent actually wrote dropped the purchase filter entirely and returned 847 rows instead of 23. Treat that as the author's constructed illustration rather than a reported production incident; it shows which signal was missing, not a measured outage.
What you actually have to capture
The definitional piece gives a concrete capture list: prompts, model responses, retrieved context, tool calls, agent decisions, latency, token usage, and evaluation results. Two entries on it carry most of the weight.
Retrieved context matters because, for RAG systems, a bad response may come from bad retrieval rather than the model itself — without it you cannot separate those two failure modes after the fact. Tool call sequence matters because order is information: what the agent called, in what order, what it received, and whether it retried.
The coding-agent case shows why the final output is not enough. An agent can plan a change, read files, run commands, modify code, run tests, interpret results, modify the code again, and produce a final diff. That diff does not contain the decision path. If something breaks, the question is which tool call or intermediate decision caused it, and only the recorded sequence answers that.
Three SRE practices that port directly
The console piece argues SRE already codified what agent monitoring needs, and almost no agent platform implements it.
- Structured log context. In traditional SRE every log line carries a trace ID, a span ID and structured metadata. Ported to agents, that means every database query the agent generates is captured alongside the original user intent, the agent's reasoning and the returned rows — the actual query text and result set, not "query executed successfully".
- Distributed tracing across heterogeneous systems. An agent calls LLMs, databases, APIs, vector stores and tools. When an orchestration involves five LLM calls and three database queries, each step should be a span in one trace, drillable down to the data that passed through it.
- Error budgets applied to quality. SREs stop shipping features when availability drops below a threshold. The agent equivalent is pausing a rollout when output accuracy drops below a defined threshold — which the author notes requires visibility into what the agent did, not just that it finished.
The trace format the piece sketches captures per span the model used, input and output token counts, the agent's reasoning string, the generated tool call including full query text, and on the execution span the rows returned and execution time in milliseconds.
The four-panel console
The proposed layout is modeled on NOC and SRE war-room consoles. A trace stream on the left shows a live feed of agent invocations, color-coded green for success, yellow for degraded quality — completed but low-confidence or unverified — and red for failure. A data inspector on the right shows, for a selected database span, the exact generated query, its parameters and a paginated view of result rows. A quality metrics bar across the top carries output accuracy measured against verified ground truth, tool call success rate, average response relevance and remaining error budget. An anomaly detector runs behind it, watching for sudden increases in NULL values, unexpected row counts and schema mismatches.
The detector's trigger condition is the useful part: when the agent consistently generates queries returning zero results on a dataset that should have thousands of rows, you want to know immediately rather than after customers complain.
Two questions a live dashboard cannot answer
The third piece splits auditing into a pair of capabilities that most setups only half-implement.
| Capability | Question it answers | Shape of the answer |
|---|---|---|
| Time-travel debugging | What did the system know, and what state was it in, at a specific past point? | Reconstruction of a single moment, on demand |
| Drift measurement | Has behavior changed compared to how it used to behave? | Comparison across many moments, watching a trend |
They close a loop: drift detection flags the window, time-travel debugging examines it. Drift alone tells you something changed without letting you inspect it; replay alone requires you to already know which moment to open.
The reason release-based monitoring misses this class of change is that agents change without anyone touching the code. A model provider ships a silent update. A retrieval index gets new documents. Users discover new phrasing that pushes the agent into behavior nobody tested. None of these register as a deployment event.
The piece implements both against ZizkaDB, an open-source self-hosted audit trail whose README lists db.at() to reconstruct what the agent knew at a timestamp and db.baseline() to detect drift against past sessions, with every agent step logged as an event linked to its cause via parent_id. The author states directly that they have not run the calls against a live instance and that the exact signatures should be treated as illustrative — so verify against current docs before wiring anything to them. The drift signals they recommend watching are less tool-specific and more portable: tool-usage shape, response length or structure, escalation and human-override rate, and decision distribution.
What none of this does
The definitional piece is explicit about the boundary: observability tells you what happened, and it does not automatically stop a bad change from shipping. You can know after the fact that an agent hallucinated a configuration value and still have had no mechanism that prevented the change from merging. That is a separate governance step.
If you are instrumenting an agent this quarter, the cheapest first move in all three pieces is the same: store the full generated query or tool call and its actual result alongside the trace, not a success flag. Everything else — drift baselines, error budgets, replay — is built on having that record. What to watch next is whether agent platforms ship row-level inspection by default, since all three authors describe building it themselves.
More from DangMua